Why you might still consider using Zabbix in 2019/2020?
Because it provides all the basic parts of a monitoring platform out of the box and it is very easy to set it up and get going.
I remember first encountering Zabbix around 2010.
Back then Nagios and Cacti (and MRTG) were the standard tools for monitoring and graphing your infra.
Zabbix back then seemed really advanced, it did it all – gathering metrics, graphing, alerting, and even displaying nice network maps. It was relatively easy to use and as I recall it, it only had one major issue, that with time, it would become really slow (the more history it collected).
However over the recent years the way how we think about monitoring has changed. And many new monitoring solutions have appeared.
I say solutions, because nowadays when you think monitoring, it most likely means building a solution that consists of multiple products.
You need an agent to collect metrics, you need some kind of time series database, then you need a monitoring/alerting platform and you also want to see pretty dashboards.
One such combination could be Kapacitor + InfluxDB + Grafana, but then perhaps you might also want to use Prometheus and if you go with that then it has its own way of collecting metrics and so it all becomes rather complicated very quickly.
This all makes sense if you do it for your business and you need to do monitoring at scale, but if you’re small or you just don’t want to ( or cannot ) spend time on setting it all up, then you are out of luck.
And this, I think, is where Zabbix comes in.
It is very easy to set up and it mostly just works out of the box.
It has good documentation, it ships packages for most distros and it has a simple architecture behind it.
Collecting metrics
The agent and the server are written in C (and there is a new agent written in GO, though it is not yet supported properly and lacks basic features such as daemonization).
They are fast. And I mean really fast. Even on tiny devices.
The agent is also felxible and it is easy to add collection of your own custom metrics. And if you want to do more, you can write a plugin in C or use zabbix-module-python.
I also have to say that I totally love the SNMP support and the auto discovery of items. Works really well with MikroTik routers.
Graphs
Zabbix has gone a long way, since last time I tried it also in terms of UI.
There’s autodiscovery for many items and there are new types of graphs which are drawn in your browser.
Let me show you what I mean.
Last time I tried zabbix, the graphs looked like so:
It is functional, but you cannot zoom and it really is a bit outdated.
And while it is of course true that graphs have to be informative and don’t _need_ to be pretty, but it sure would be nice if they were.
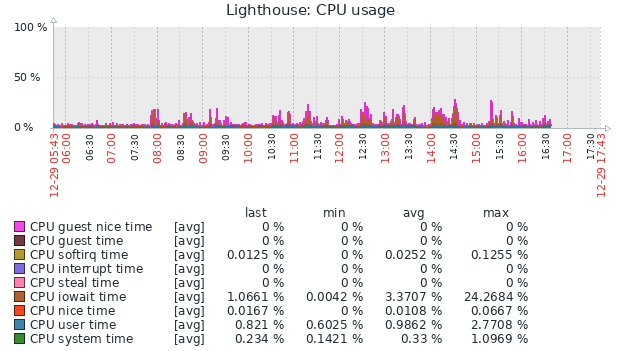
Seems the Zabbix devs have realised it as well and you can now create much better looking graphs that are rendered in your browser and you can have all the nice thing like zooming in.
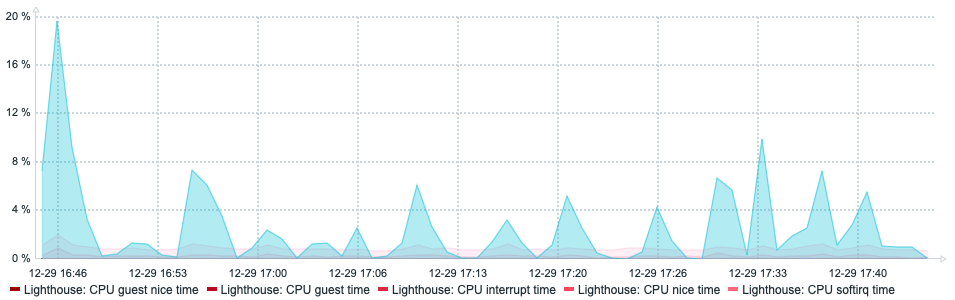
They are bit limited, but it is a move in the right direction.
There is the built in functionality to do maps, which is really cool way to visualise your infra.
Notifications
It is easy to set up triggers based on the metrics that you collect and you can do all kind of notifications (schedules, different severities, different means of notification transport etc.), including a built in support for Pushover, which I really like.
However the world has moved on
For my personal needs of monitoring few linux boxes and a few mikrotik routers, Zabbix is working out really well. And a raspberry pi (model4) is a totally adequate hardware to host it on.
However, the thing is that as I mentioned in the beginning the world has moved on, in the online services world we now mostly focus on SLOs and monitoring service performance and availability, meaning that noone really cares (or should care) about performance of a single machine and how much the CPU is utilised on it, so long as the service is performing well.
Nowadays, with having thousands of machines in the cloud you really want to instrument your service and perhaps supplement that with client synthetics and then monitor the aggregated result of those.
Zabbix does seem to support monitoring of services (though I have not tried that), but out of the box it really seems to be quite focused on monitoring system resources and their utilisation.
I would add support for runners/synthetics and make it really easy for people to use them, this could help them a lot I think in making Zabbix more relevant for online service monitoring.
And they should also move to github and leverage the masses while its not too late.
It is great that Zabbix is open source, but why not go all the way and make it easy to accept contributions and engage community?
I will continue using Zabbix for my personal needs and I’m a huge fan of how efficient it is. As a product of a small Latvian company, I think they have done tremendously well and I wish them the best of luck!